This is the first of a series of blog posts in the coming weeks that provide select insights from our 2015 Registered Investment Adviser (RIA) Industry Overview Report that will be released later this summer. This proprietary RIA in a Box study used detailed survey responses from 1,198 advisory firms paired with publicly accessible data provided on the Securities and Exchange (SEC) website.* The goal of this annual study is to understand different options that comprise each firm characteristic, and to determine whether specific characteristics affect the growth, size, or operational efficiency of an RIA firm.
Key Industry Metrics
As of May 2016, there were nearly 35,000 RIAs registered with the SEC and state securities regulators with approximately $67 trillion of total assets under management (AUM). To have a point of comparison for our survey results, here is a closer look at a few bench marking metrics of the overall RIA industry:
")
It is important to note the large separation between the industry’s average AUM and median AUM. The RIA industry has a handful of exceptionally large RIAs with billions in assets that skew the calculated average AUM to a value that is not representative of the majority of traditional investment advisory firms. For example, Vanguard Group Inc.’s total AUM figure of more than $3.2 trillion* is nearly ten times the total AUM figure of $336 billion for all 19,485 state-registered RIA firms combined. The industry’s focus on the average AUM often overshadows the overall fragmentation of the industry. There are currently more than 13,000 advisory firms operating today with less than $50 million in assets.
It’s also important to note that our survey respondents are likely subject to inherent biases. After objectively looking at the survey results, we concluded that there may be a small bias toward newer and smaller RIA firms, a result reflected by the average and median AUM figures displayed in the table above. However, we strongly believe that the survey results analyzed in this white paper represent a large and diverse group of investment advisory firms and allow for observations about the RIA industry as a whole.
Average RIA Industry AUM Growth Rates
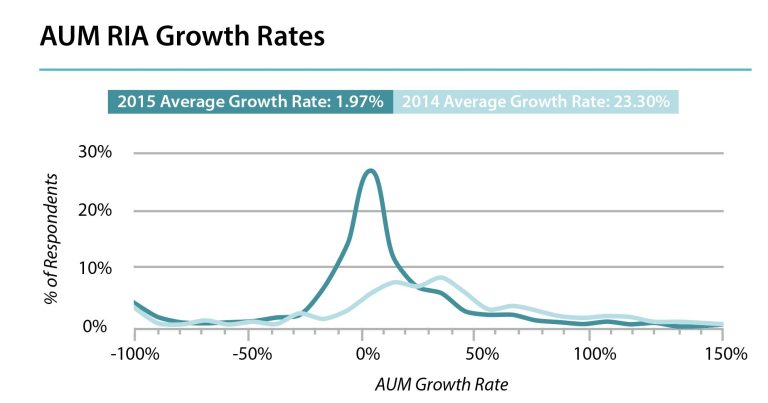
For the 2015 calendar year, we observed that the overall average AUM growth rate of RIA firms dropped significantly compared to the 2014 calendar year. Much of this decline can be attributed to the relative performance of the equity markets over the past two years, but nevertheless demonstrates the potential year to year revenue volatility of a typical investment advisory firm regardless of size. The chart below reflects the average AUM growth rate for RIA firms during the 2015 calendar year was 1.97%. This compares to an average AUM growth rate of 23.30% during the 2014 calendar year. growth rate")
In both 2014 and 2015, the average growth rate exceeded the S&P 500 index return (+13.52% in 2014 and +1.36% in 2015). However, it appears that the volatility of growth rates was much more pronounced in 2014 compared to 2015. In 2015, a significant number of survey respondents experienced growth rates close to the industry average compared to 2014 when growth rates were more varied. This will be an interesting observation to revisit in future years to see if the absolute return of the public equity markets continues to be positively correlated with higher asset growth volatility.
Future Topics Covered
In subsequent blog posts in the coming weeks, we will focus our analysis on the traits and behaviors positively correlated with relative AUM growth rates compared to peers. In particular, we will focus on the following topics:
- Portfolio Management Style: Active vs. Passive
- Portfolio Operations: In-house vs. 3rd party portfolio management
- Financial Planning: Frequency of firms offering financial planning services
- Technology Adoption: Types and number of technology systems being utilized
- Investment Advisory Fees: Average industry fees charged
In addition, we will also reflect on some key year over year observations compared to the prior year’s study to determine whether past trends once again were reflected in this year’s study.
*Source: SEC and state investment adviser firm reports as of June 8, 2016 available on the SEC Investment Adviser Public Disclosure (IAPD) website. Vanguard Group Inc. (CRD #105958) Form ADV as of June 30, 2016.